Creating Accessible Visualizations with Chartability
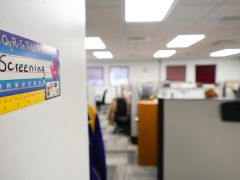
Impact: Teaching others to recognize the barriers to inaccessible design
Creating accessible online data experiences requires a blend of technical skill, awareness of usability principles, and creative design thinking to communicate effectively with everyone. Our Chartability framework provides guiding questions to help anyone learn to identify and remove barriers in data visualizations and interfaces. By promoting inclusive design, Chartability empowers creators to build data experiences that ensure equal access to information for audiences with disabilities worldwide.
We produced Chartability, a set of guidelines and heuristics for evaluating the accessibility of data visualizations.
This work led to...
- Use in more than 15 government and policy agencies for accessibility and inclusion of people with disabilities, leading to more informed decision-making and better access for the people they serve. Internationally, Chartability was used to help develop the World Health Organization’s Data Design Language, the European Commission’s Data Visualization Guide, and the Quebec Government’s visualization design system. In the US, we have consulted with (or our work has been used by) the National Institutes of Health’s Common Fund, the Office of Science and Technology Policy, 18f, United States Geological Survey Vizlab, USAID style guide, the United States Web Design System, and non-federal contexts, such as the State of New Jersey's Open Data Center and the State of California's Office of Innovation.
- Contributions to accessibility curriculum and instruction at universities around the world, helping to teach the next generation how to build more accessible visualizations. Our research has been used for curriculum on accessibility in data visualization at more than 20 universities, including MIT, Carnegie Mellon University, University of Washington, Gallaudet, and CU Boulder, to name a few.
- More accessible data products for industry partners and their customers. This work has contributed to more accessible data products, services, apps, and platforms at Microsoft (PowerBI, Azure, Github), Apple, Google, Intel, Visa, Adobe, Tableau, Fizz Studio, Jupyter, Canva, and Observable.
- Produce more accessible data journalism to inform citizens with disabilities around the world. Our work has been used in collaborations with (and also independent of our involvement) to contribute to more accessible data journalism, visualization, and reporting at the New York Times, the BBC, Reuters, the Pudding, FiveThirtyEight, the 19th, the organization of Investigative Reporters and Editors (IRE), and the Financial Times.
- More than 50 invited talks and workshops where we had the opportunity to educate thousands of practitioners. We also contributed to accessible visualization projects including open source communities that serve millions of developers, designers, and researchers internationally. Our work has been used to teach people and ignite new projects in many different groups across the world, including: Data Visualization Society, arXiv, Academic Data Science Alliance, the A11y Project, the Special Olympics, Jupyter Project, Vega-Lite, Data Science By Design group, Graphic Hunters, NovaUX, DataViz DC, A11yViz Group, Outlier, AccessU, Knowbility, DataViz Today, and Linkedin Learning.
Supported by: Fizz Studio, Inc
Timing: 2020 - Present
Related work:
- “How accessible is my visualization? Evaluating visualization accessibility with Chartability” [paper pdf]
- Chartability workbook [link]
- Follow-up CZI-funded grant to apply our work to Bokeh’s interactive visualization ecosystem [link]
Researchers: Frank Elavsky, Cynthia Bennett, Dominik Moritz
Looking at Additional HCII Impacts...
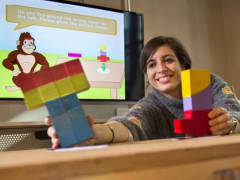
NoRILLA Interactive Mixed-Reality Science for Kids
Our novel, mixed-reality intelligent science stations bridge the physical and virtual worlds. Millions of children and families across the US are learning more science and improving their critical thinking skills after predicting, observing and explaining experiments with our patented system at their schools and museums.
Creating Accessible Visualizations with Chartability
The Chartabilty framework has empowered people around the world to recognize the parts of a data visualization that produce barriers for people with disabilities. It has contributed to dozens of design languages, visualization guides, accessibility curriculum at universities, and the data journalism seen on news websites.
Improved Math Mastery with the Decimal Point Game
We explored the learning analytics behind our digital learning game to see how student learning responds to curriculum changes to the game. Over the past 10 years, over 1,500 students have benefited from the Decimal Point game and curriculum materials.
Supporting Developers So They Can Build More Responsible AI
We conducted the first studies with industry practitioners to understand the challenges they face when building responsible AI systems. Our tools and methods are now supporting developers around the world.
Understanding the Impacts of AI in Child Welfare
We conducted the first field studies to understand how child welfare workers incorporate AI-based recommendations into their decision-making, which had far-reaching policy impacts.
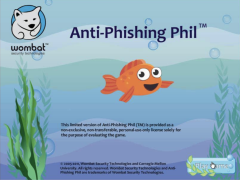
Protecting Millions of People from Phishing Scams
We studied the social aspects of phishing attacks and protected millions of people through education and training. This work led to new educational methods to raise awareness, effective anti-phishing warnings, and algorithmic detection of phishing attacks.
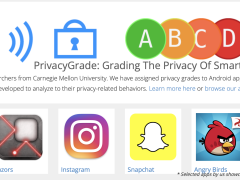
Grading Your Smartphone Apps on Their Privacy Practices
We created a model that analyzed over 1 million smartphone apps on their privacy and data collection practices, and then assigned them a public-facing privacy grade. This easy-to-follow grading system raised public awareness and led to improved privacy practices from several app developers.
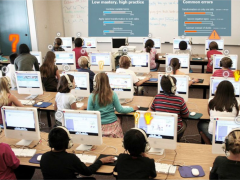
Designing Teacher-AI Collaboration Systems
Hundreds of elementary and middle school students across the US have learned more as a result of our work on real-time, teacher-AI collaboration systems in K-12 classrooms.
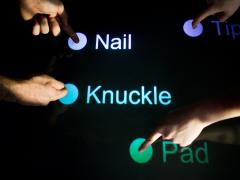
TapSense Improved Touch Detection on Millions of Smartphones
We trained smartphones to reliably detect four different touchscreen inputs – for example, a tap by a finger pad as compared to a knuckle – which created opportunities for new interactions and features.
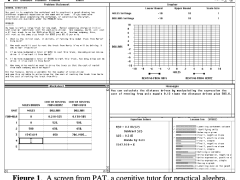
Millions Learned More Math with Our AI Tutor
Millions of middle school and high school students across the US have learned more math as a result of our decades of work with AI-based cognitive tutoring systems.
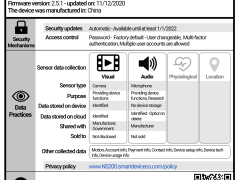
Human-Centered Privacy for the Internet of Things
As more gadgets become “smart” things and the Internet of Things (IoT) expands to tens of billions of connected devices, we want consumers to be aware of what their devices are doing with their personal data.
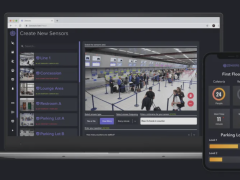
Zensors Turns Cameras Into Smart Sensors
In one application installed at the Pittsburgh International Airport in 2019, Zensors use existing cameras as powerful general-purpose sensors to provide wait time estimates for the security line, which benefits almost 10M PIT travelers per year.
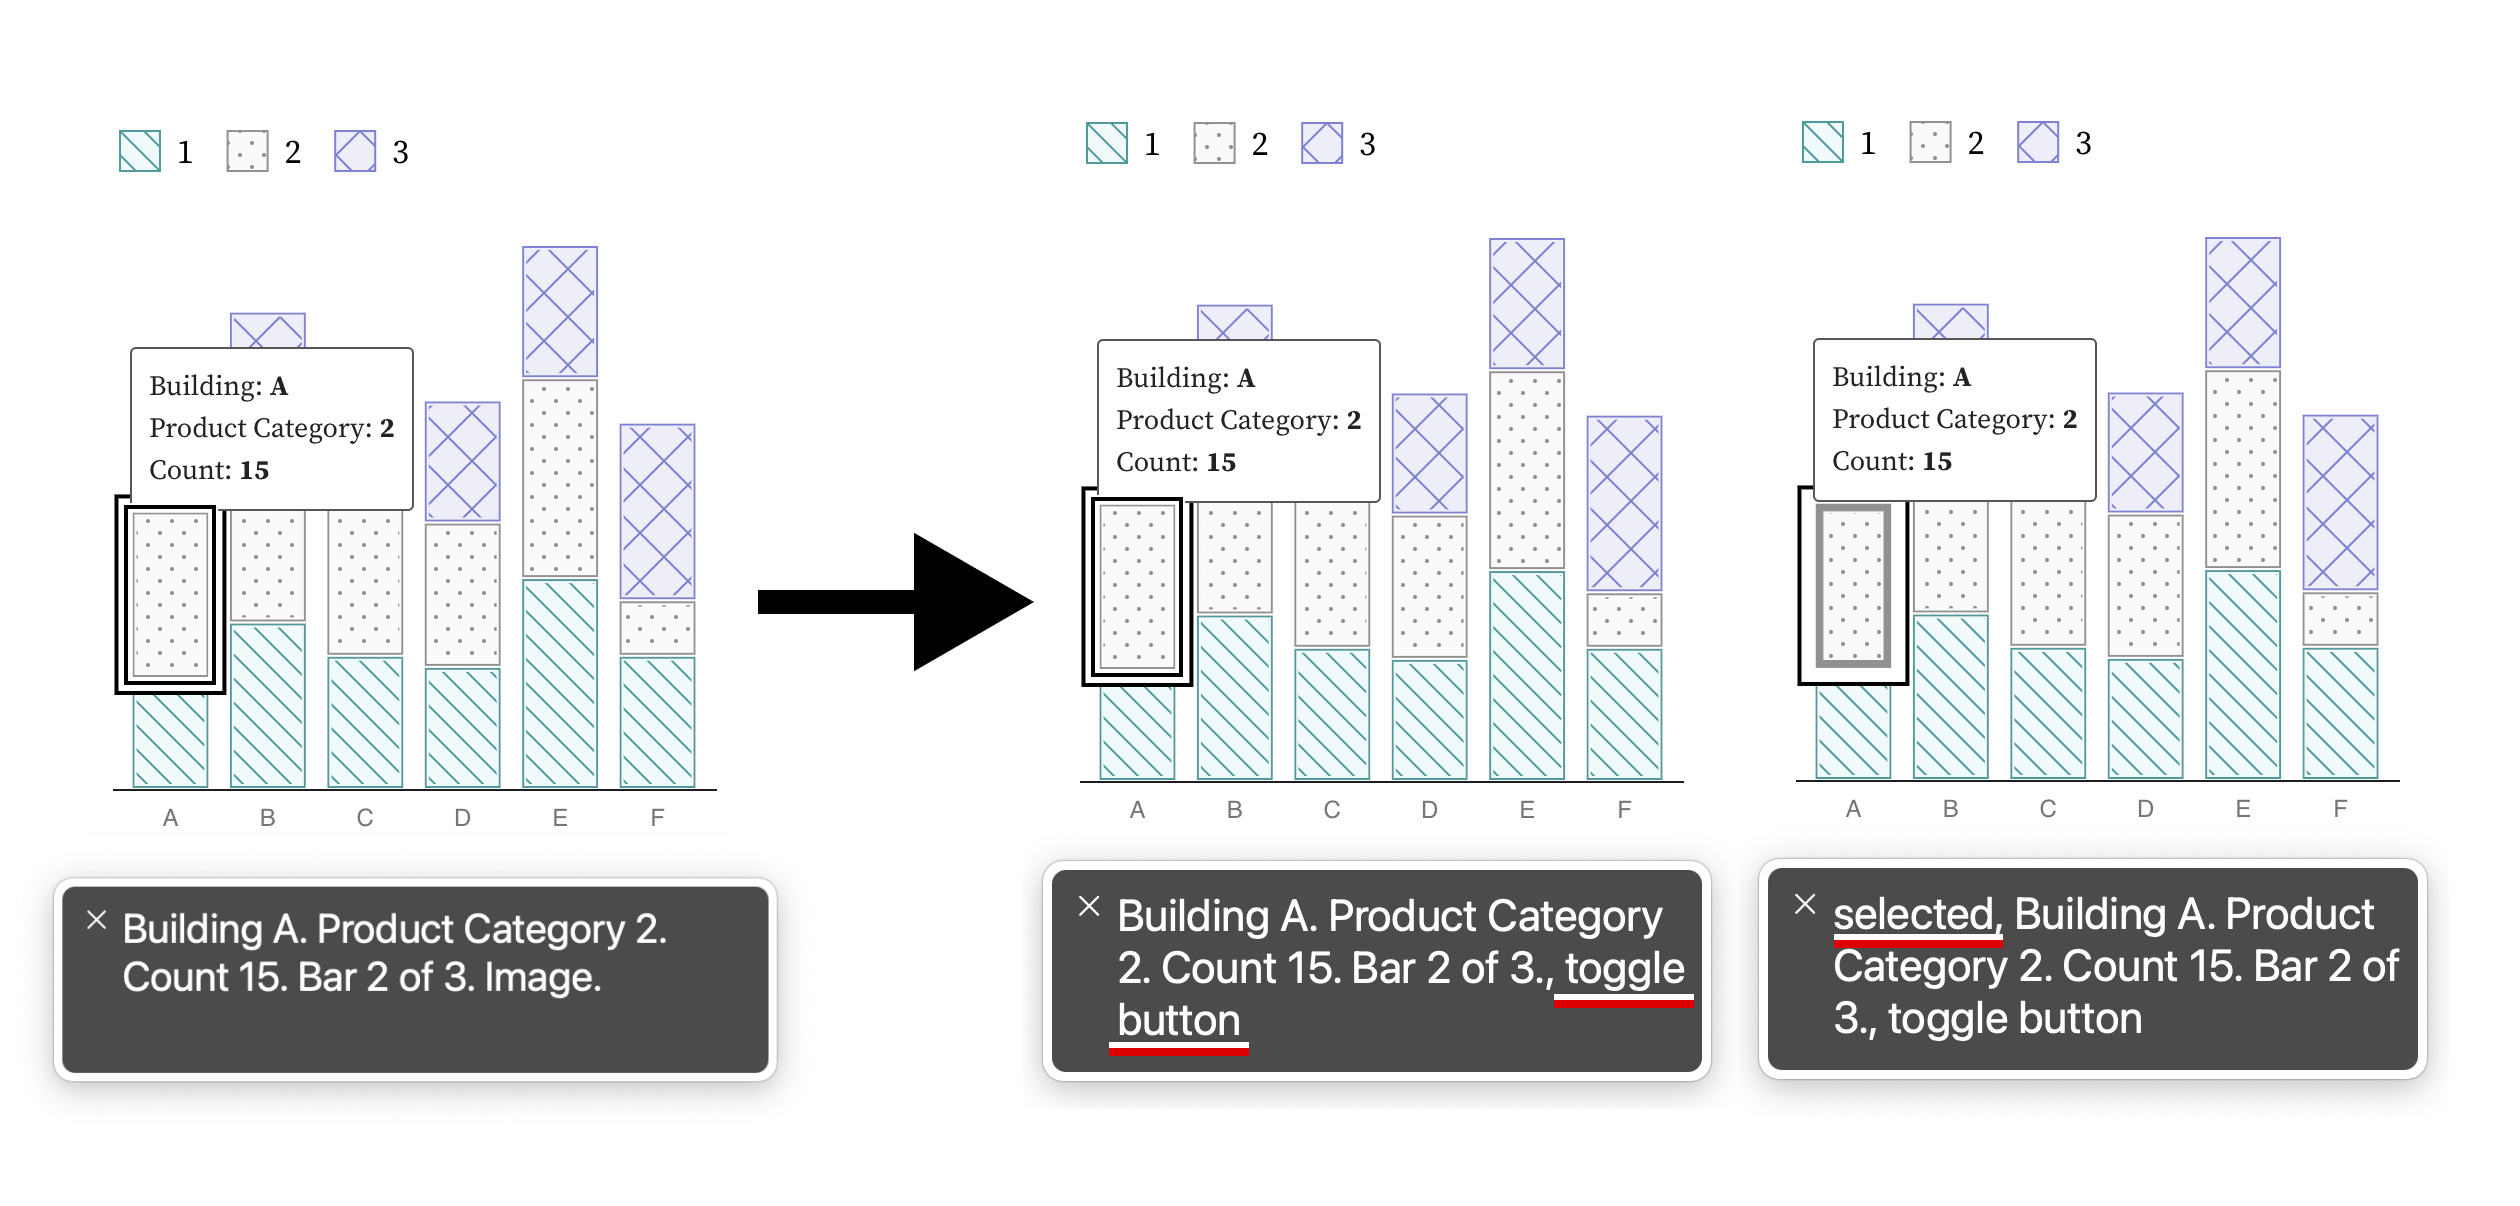
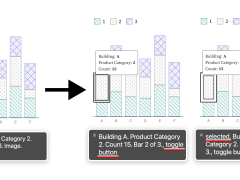
This interactive bar chart allows users to toggle through the data.