CMU logo
Expand Menu
Close Menu

Human-Centered Data Science

Researchers:
  • We built a visualization dashboard called Rx RiskMap that communicates and explains the results of a model to predict overdose risk across the state of Pennsylvania. The data shown is outdated and depicted for demonstration purposes only.

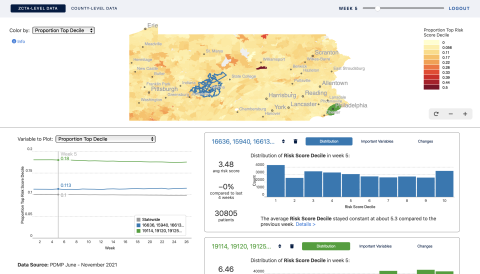
    Predicting and Visualizing Overdose Risk for Public Health

    PROJECT

    Overdose due to opioid misuse and abuse is currently a critical public health issue in the United States and worldwide. Machine learning (ML) approaches h...
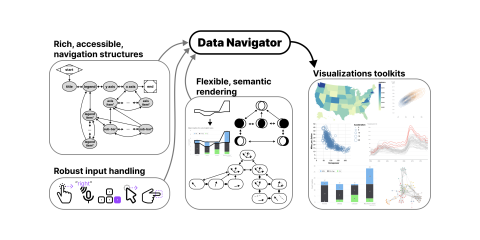
  • Data Navigator provides visualization toolkits with rich, accessible navigation structures, robust input handling, and flexible, semantic rendering.

    Data Navigator

    PROJECT

    Data Navigator is a JavaScript library that allows for navigation of data structures. Data Navigator makes png, svg, canvas, and even webgl graphics acces...